Advanced 3D Visualization and Analysis tools in a straightforward and familiar way
Perform complex analysis methods without learning a new platform.
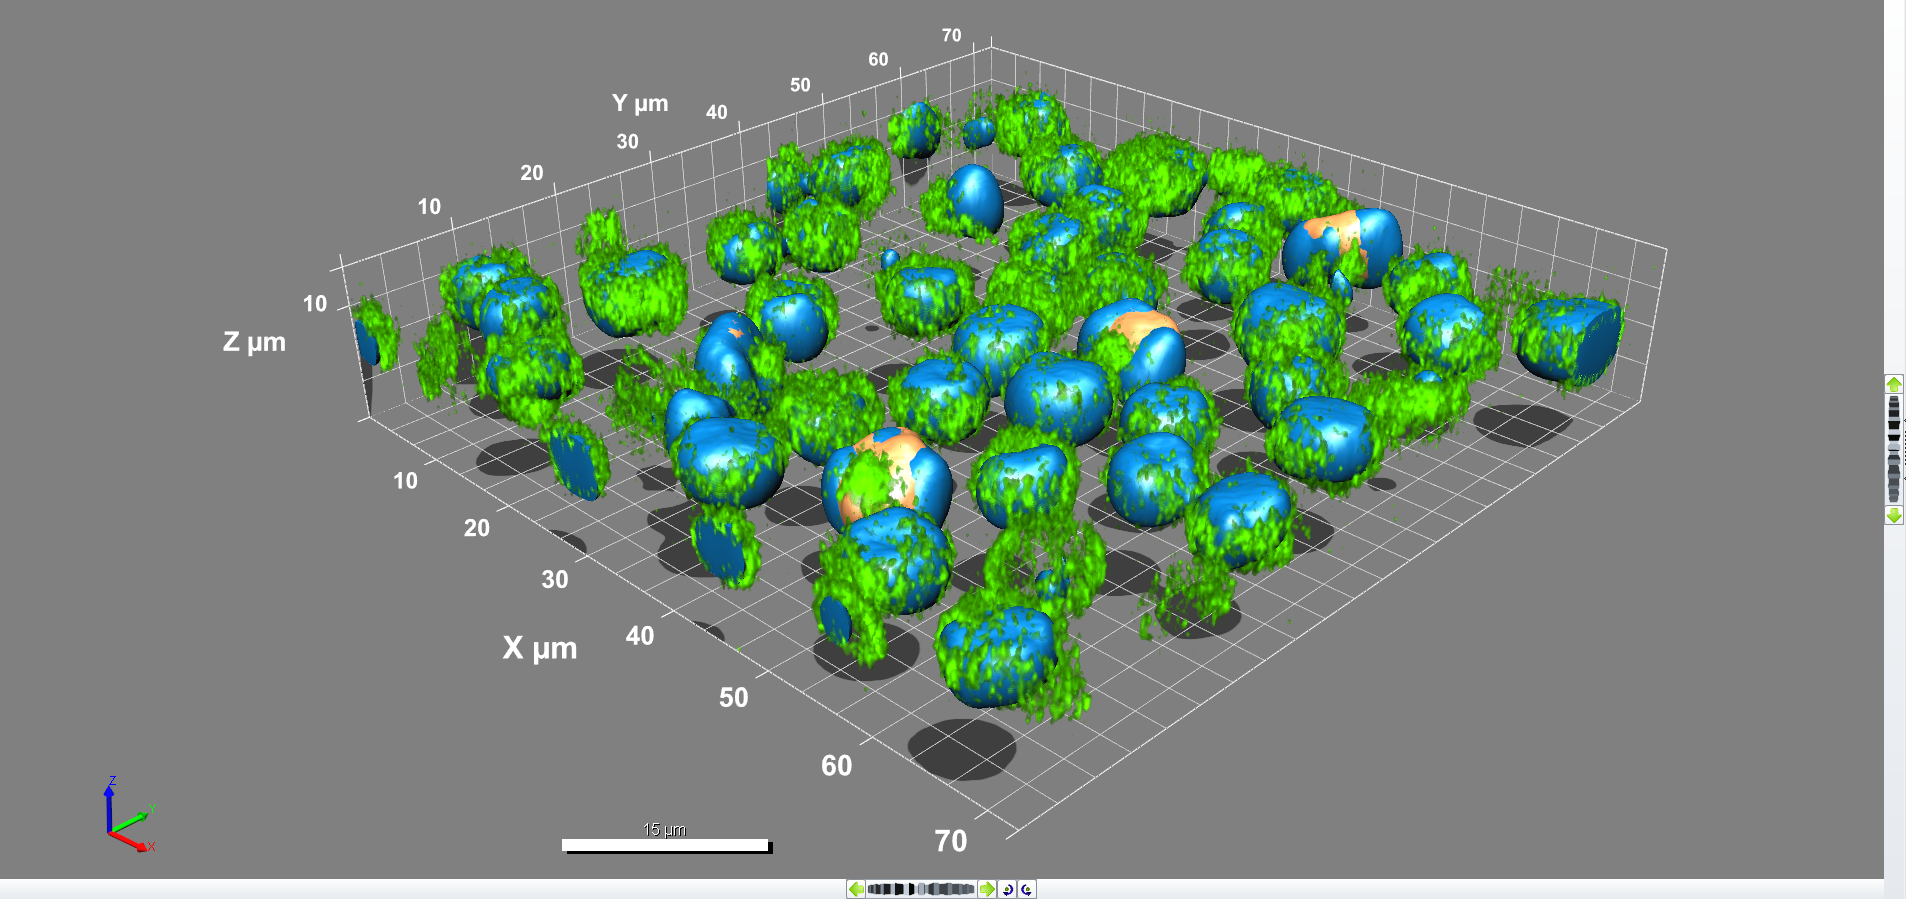
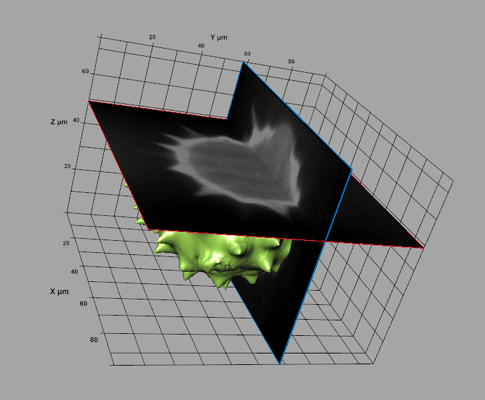
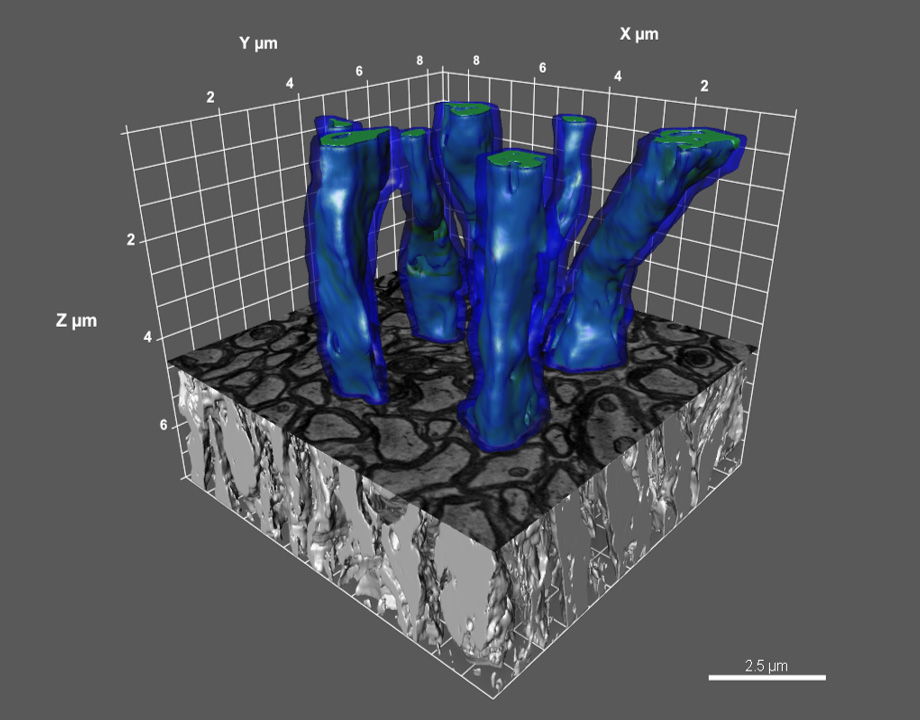
Superior Visualization
Axis Labels
Raw Data Renderings
Iso-Surface Renderings
Calibrated Grid
Directional Light Shadows
Orientation Axis
Calibration Marker
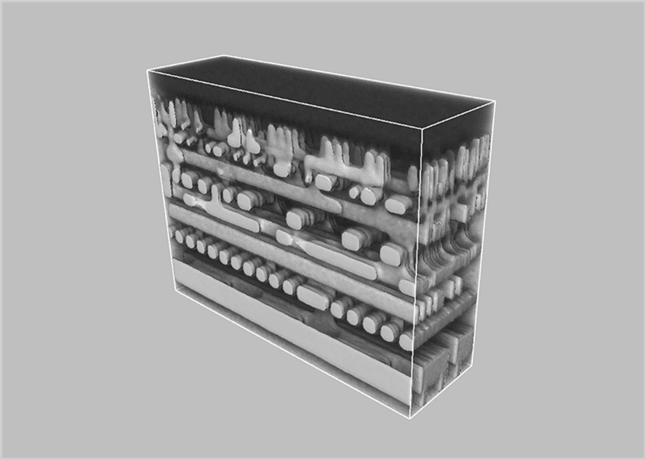
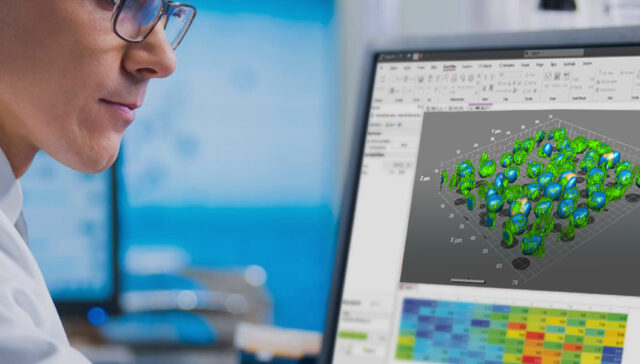
3D/4D View
Visualize your 3D volumes or 4D time-lapse data in stunning high-resolution full-screen views.
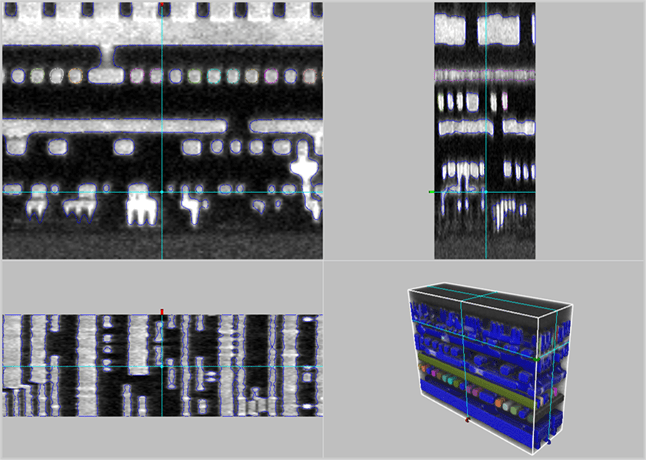
Slicer View
Explore every voxel using this 2D projection mode that links the position of the 2D plane to a real 3D position on the integrated 3D view.
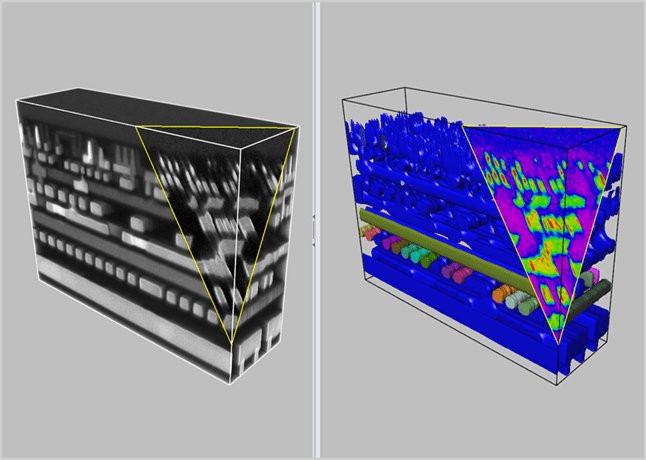
Synced Comparison
Sync any two data sets for side-by-side viewing, zooming, and panning. Even sync two different view types such as a 3D View and a Slicer View in real-time.
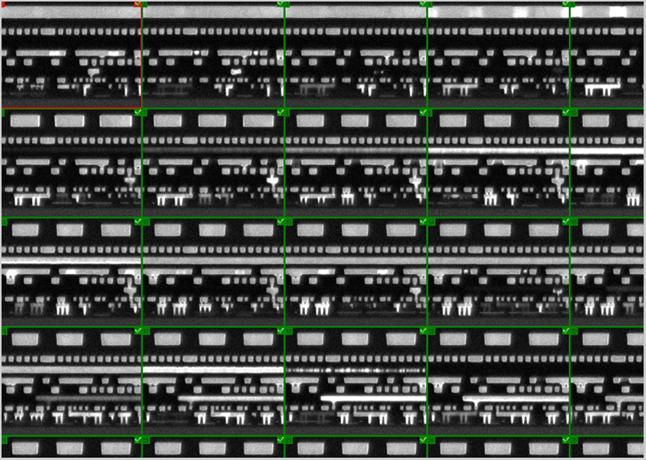
Gallery View
See every frame that makes up the volume in a gallery of thumbnails able to be scaled, edited, adjusted, or simply viewed in this mode.
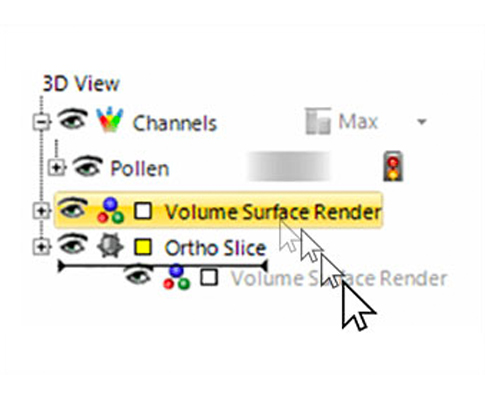
Control What You See
Adjust lighting, appearance, surfaces on volumes, objects, and channels to display striking results.
Volume Adjustments
Blend, MIP, & Sum Projections
Overall Volume Transparency
Wireframe & Isosurface Renderings
Slice Density & Edge Coloring
Pseudo-Surface & Stereo Views
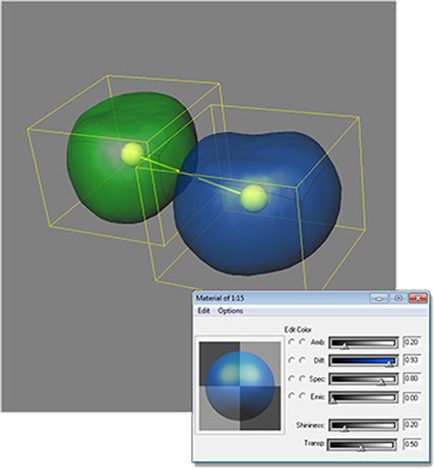
Object Parameters
LUT-based Spread & Opacity
Individual Object Specularity
Color Palette Editor & Presets
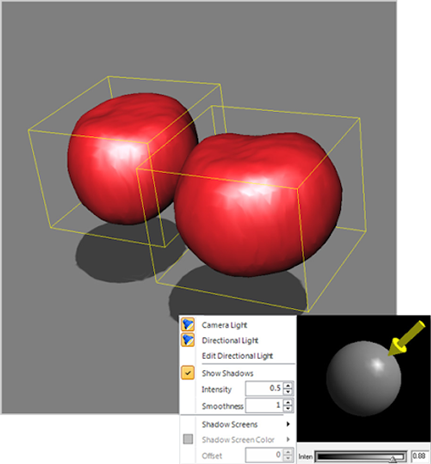
Light Sources & Shadows
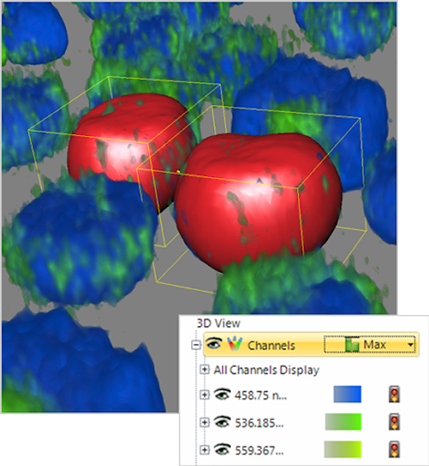
Channel Parameters
Retain native channel coloring
Toggle or Blink each channel
Opacity weighted auto blending
Independent histogram edits
Channel extraction or Merging
Change Backgrounds
Change your background and apply gradient bleeding to create the highest possible contract between your data and the background.
Apply Shadows
Shadow Projections can produce shadows on 3 walls of the volume frame and accentuate the morphology and interaction of objects.
Adjust Lighting
Control your volume's light in two different directions with intensity, color, and angle adjustments.
Remove Regions
View the interactions of various materials by clipping away distracting or unnecessary regions using a Volume of interest.
3D Clipping Planes
Easy-to-use clipping tools let you select a clipping plane, orientation axis, and clipping priority, then traverse the axis, viewing 2D slices of any 3D image.
Adjust Orientation
Create any number of clipping planes and easily traverse the axis of orientation. Reveal what a 2D plane in any position looks like or turn clipping on to erase data before or after the plane.
Arrange Priority
Select any clipping plane in the 3D View Panel and move it above or below other clipping planes or 3D elements to adjust the clipping priority. Items on top clip all those below it, it’s as simple as that.
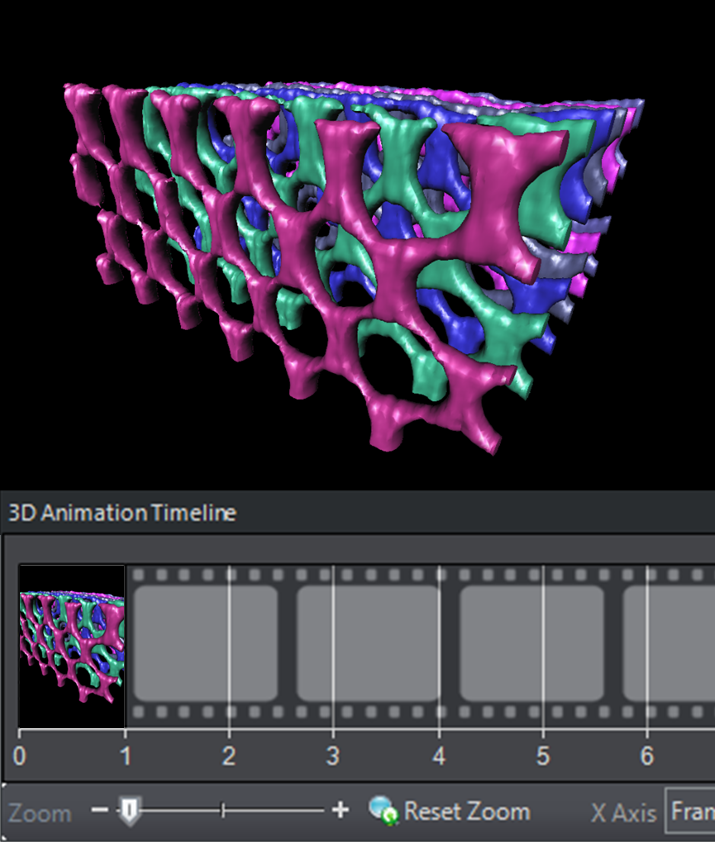
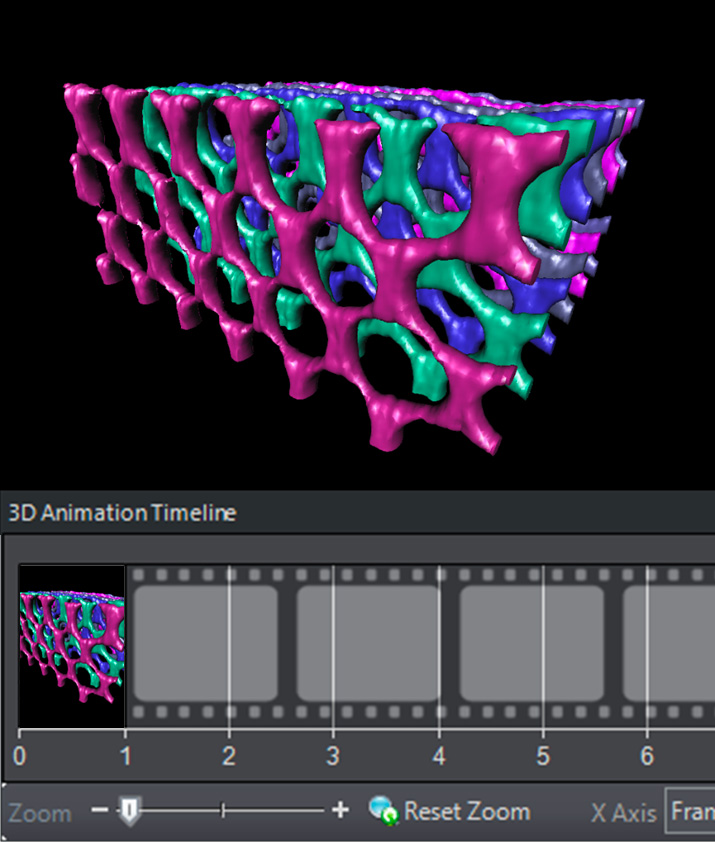
Key Frame Animations
Powerful animation tools enable the creation of realistic movies composed of complex movements & renderings. Hover to explore.
Remove material using a clipping plane for a reveal effect
The Big Data Visualization extension converts the large datasets* captured by today’s high-volume imaging techniques to multi-resolution pyramidal formats for quick, easy visualization.
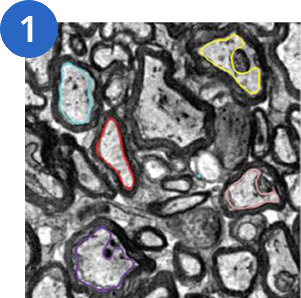
Guided Segmentation is designed to enable the identification and measurement of any 3D Object using a simplified guided process that excels over current 3D segmentation techniques.
Generate Outlines
Use any 2D frame to define objects as unique collections of outlines. Name and color code them for clarity.
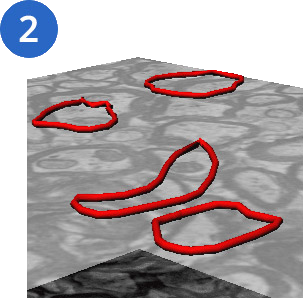
Z Propagation
Propagate the segmentation up or down through the stack, using Auto or Semi-Auto techniques and review the outlines for edits as needed.
Isosurface Creation
Automatically generate isosurfaces from your collection(s) of outlines. Measure volume, surface, intensity, and unique morphological object measurements.
Manual 3D Measurements
Measure isolated 3D objects using straightforward point-to-point tools when individual object geometry is needed.
Distance, Areas, Volumes
3D Centroids
Surface Area
Circumferences
Distance between objects
3D lengths from surface to center
3D lengths following along an object's surface
Centroids, Angles, Contours
3D Object Contours using 2D polylines on slices
X, Y, Z Size, Shape, Orientation and Intensities
X, Y, Z coordinates at any 3D location
Distance between objects, and merge/split
Relative Angles between lines
Relative Angles to reference vectors
Retain Quantitative Accuracy
Calibrated voxels based pm XY Spatial calibrations and Z-spacing calibration
All measurements are based on precise sub voxel accuracy
Automated 3D Analysis
Analyze 3D objects using histogram-based segmentation methods to easily calculate region dimensions, morphology, object count, intensity measurements, and more. Combine with the data collector and batch processing to analyze large amounts of data in just a few clicks.
Segment by Intensity
Use histogram-based methods to select your areas of interest, instantly highlighting them as 3D objects in the volume display. There is no limit to the number of segmentations you can perform, so even subtle variations in gray-scale or color can be separated for analysis.
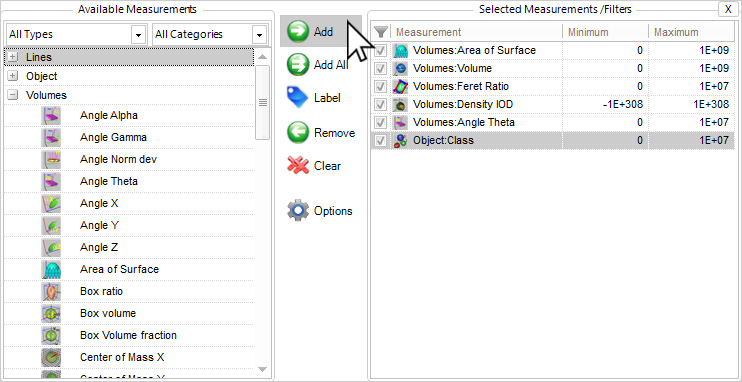
Filter by Measurement
With any of the chosen measurements, create a histogram of your segmented regions and only keep what you find relevant, excluding the rest using multiple precise parameters such as a combination of morphology and intensity measurements.
Classify by Measurement
With any of the chosen measurements, create a histogram of your segmented regions and only keep what you find relevant, excluding the rest using multiple precise parameters such as a combination of morphology and intensity measurements.
Eliminate Objects Touching Image Border
In cases where you only want complete and intact volumes that are not cut off by the image stack’s borders, you can enable the clean borders setting to ignore these objects.
Object Appearance
The appearance of each object is very important to accurate visualization so parameters for each object are able to be edited including color, transparency, and specularity.
Object Splitting & Merging
It becomes necessary to split touching objects in many images, so we’ve provided both automatic watershed-based splitting techniques and a manual point-to-point-based splitting method to get the job done.
Object Naming and Coloring
This makes it easier to keep track of “what’s what” by allowing you to give each object a unique name and color by editing the data table or simply double-clicking the object itself.
3D Data Management
Make the data work for you.
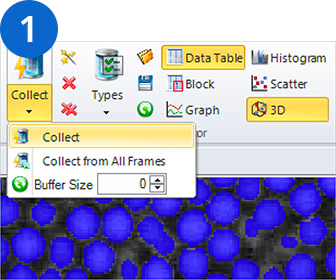
Set Data Collection
With the press of a button all the data from your table is compiled into Data Collector. You can even set it up to collect from all images automatically as they are measured.
Link Collected Data
For a multi-image experiment, collect large clusters of data from each image separately and retain the original links to understand how image groups compare and contrast.
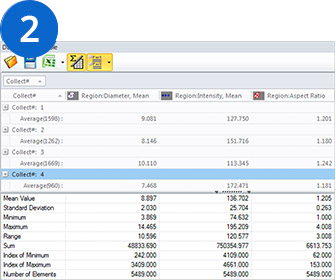
Graph the Results
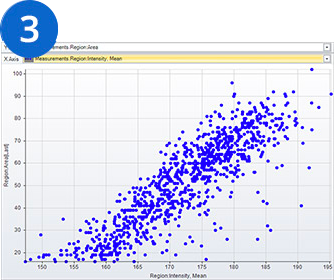
Use a variety of graph types for your data such as 2D and 3D scatterplots, histograms, block charts, and line graphs.
Choose from 60+ measurements to display in tables and graphs
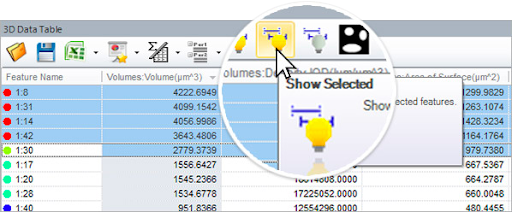
Sort and Condense
Sort by measurements and adjust tables to only show the relevant data.
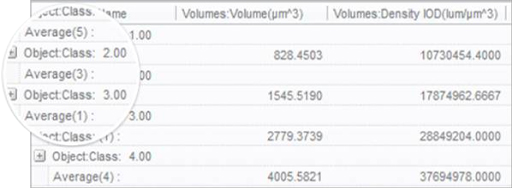
Group Results and View Statistics
Combine classes of similar objects into a custom hierarchy and see statistics per measurement for each grouped class.
Like What You See?
Get Started with Image-Pro for 3D Visualization and Analysis